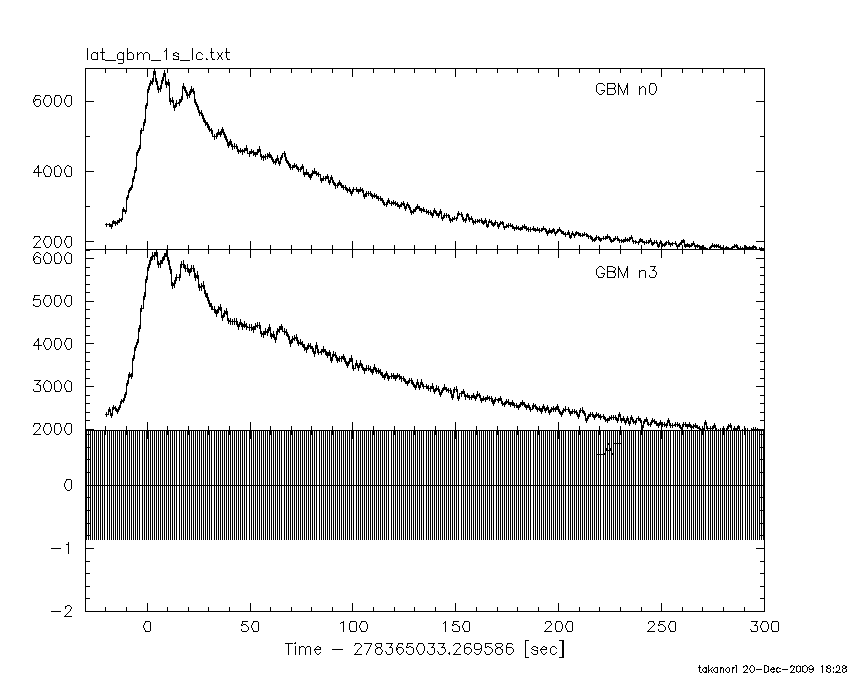
Fermi-GBM UNRELOC091027817 Summary
Trigger Summary
Trigger Time [MET]        : 278365033.269586
Burst Pos RA [deg]        : 127.5167
Burst Pos Dec [deg]       : 40.0000
Burst Err Radius [deg]    : 34.6000
Trigger significance [sig]: 6.3
Trigger time scale [ms]   : 2048
Trigger channel low       : 2
Trigger channel high      : 2
Trigger channel low (ADC) : 143
Trigger channel high (ADC): 258
Triggered detector        : 100100000000
SC Geo East Long [deg]    : 999.0000
SC Geo North Lat [deg]    : 999.0000
GBM Light curves
Notes:
- 1) The data are from the Fermi-SDC: http://heasarc.gsfc.nasa.gov/FTP/fermi/data/
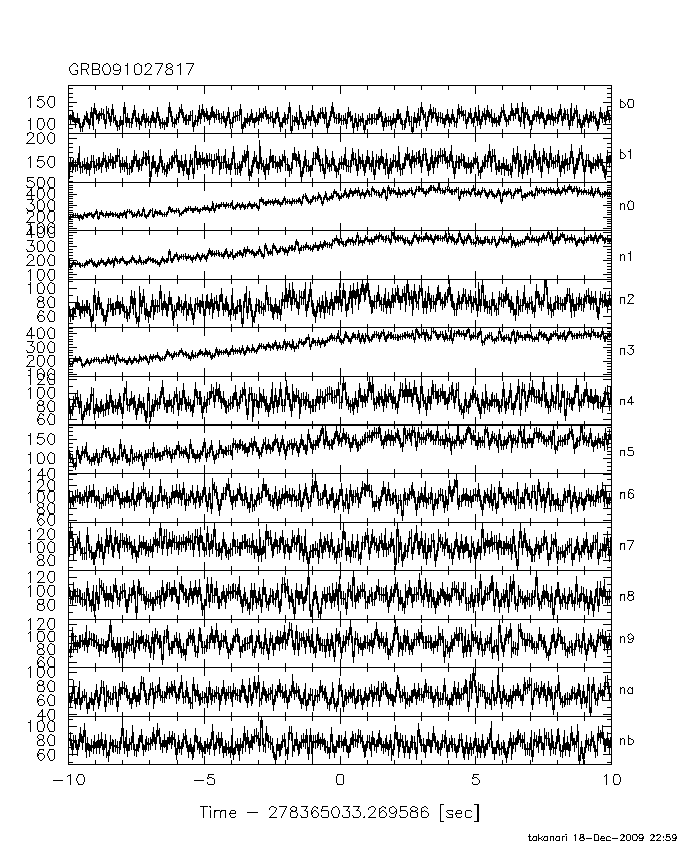
- 2) The light curve is generated using the Fermi-tool gtbin for the TTE data.
- 3) The individual panel shows the GBM light curve for each GBM detector (GBM-BGO: b0 and b1, GBM-NaI: from n0 to nb) in full energy range.
1s binning
All interval
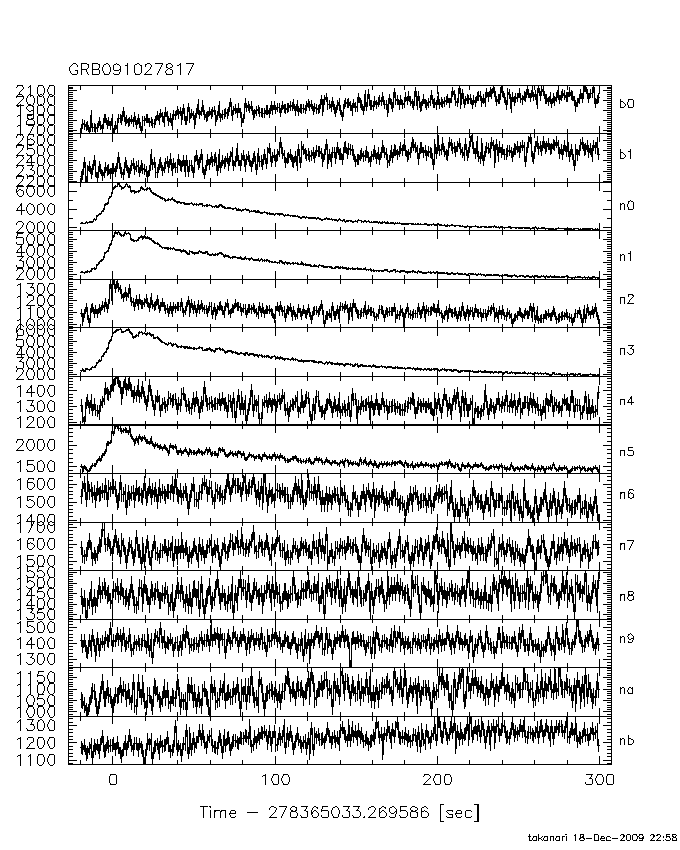
From T0-10 to T0+100
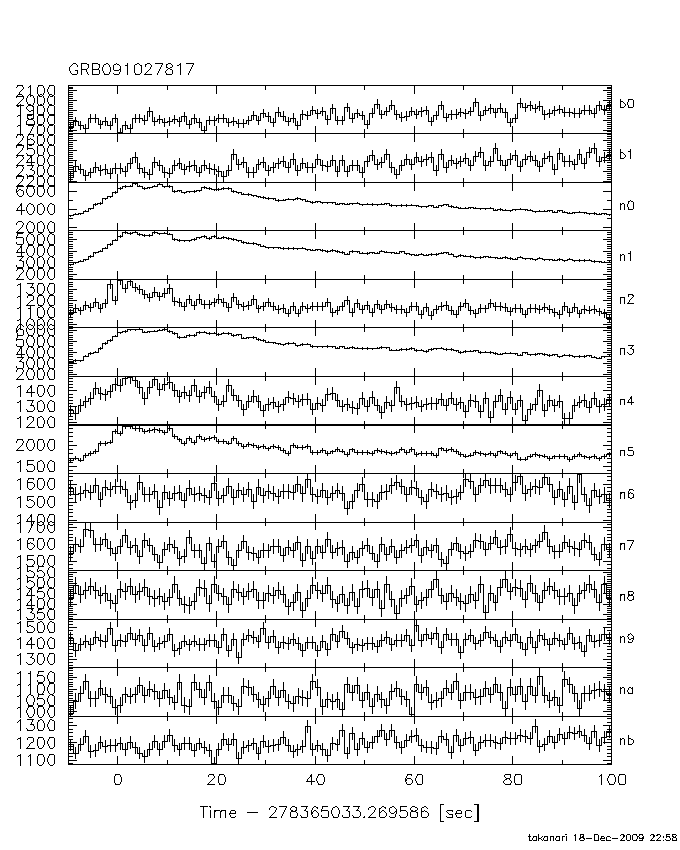
From T0-10 to T0+50
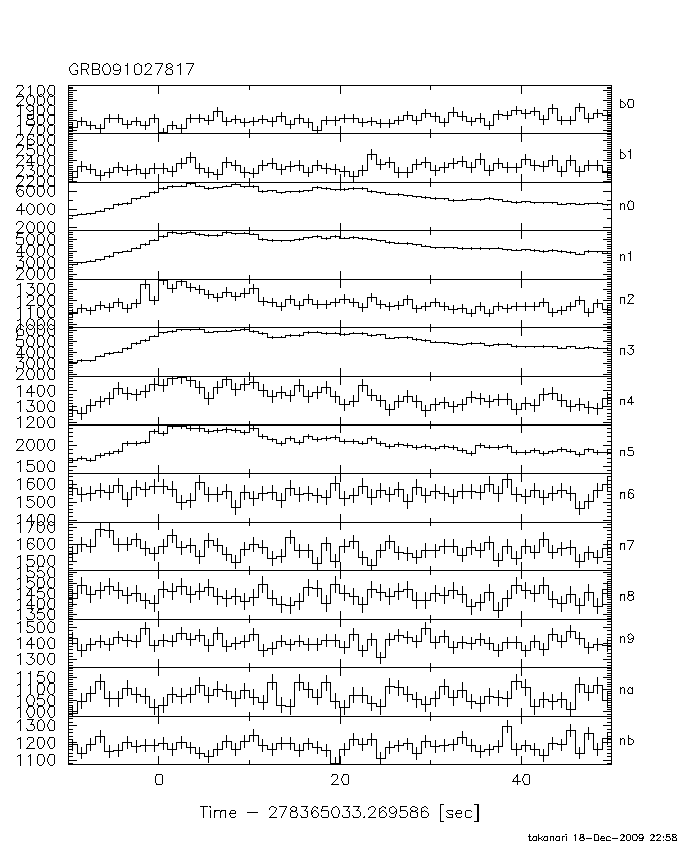
From T0-10 to T0+10
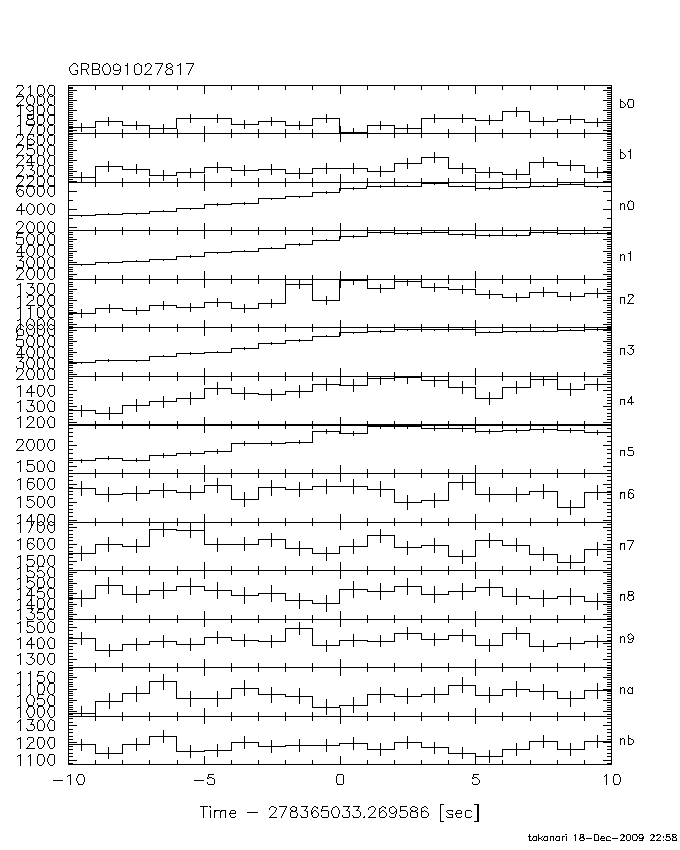
64ms binning
All interval
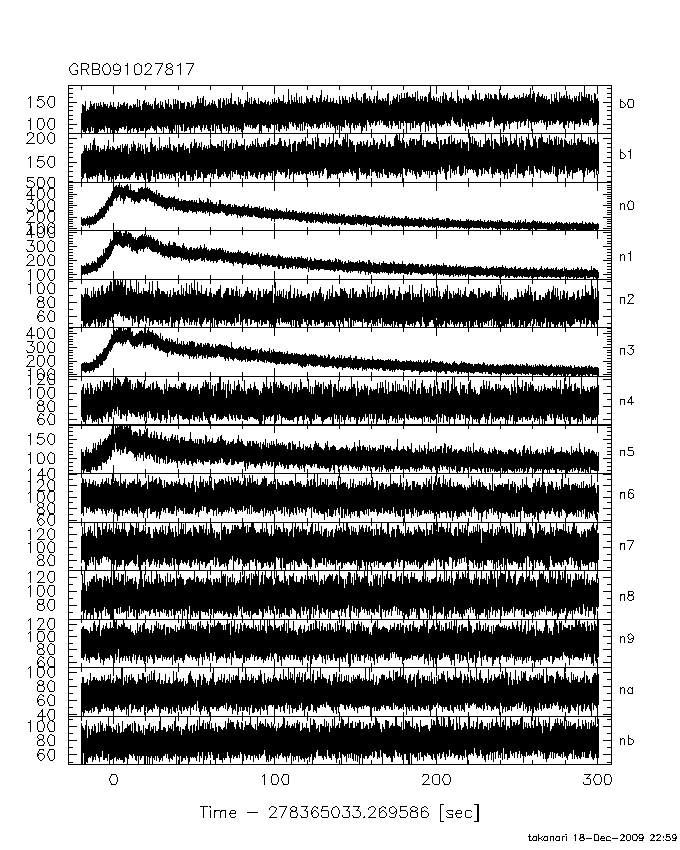
From T0-10 to T0+100
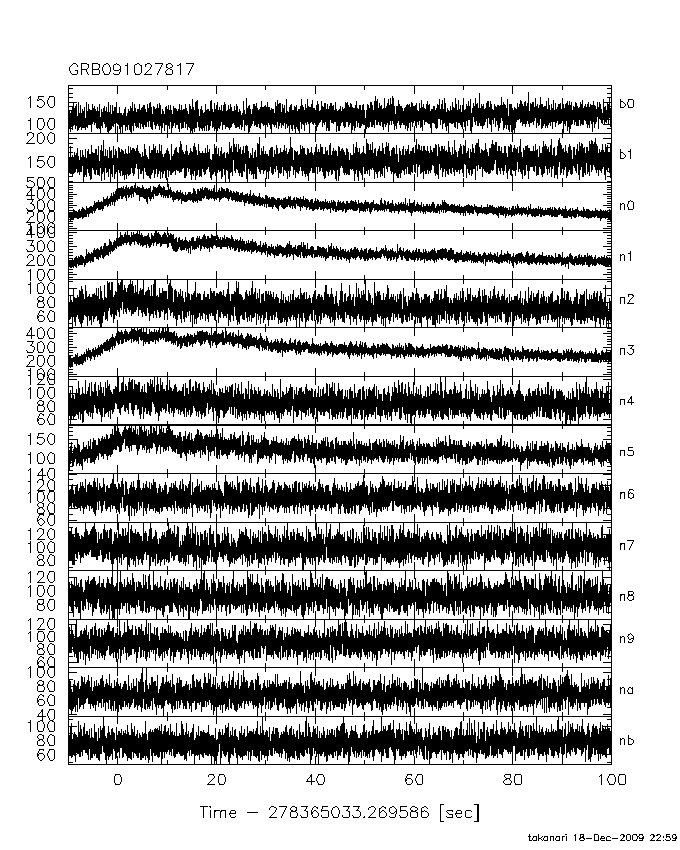
From T0-10 to T0+50
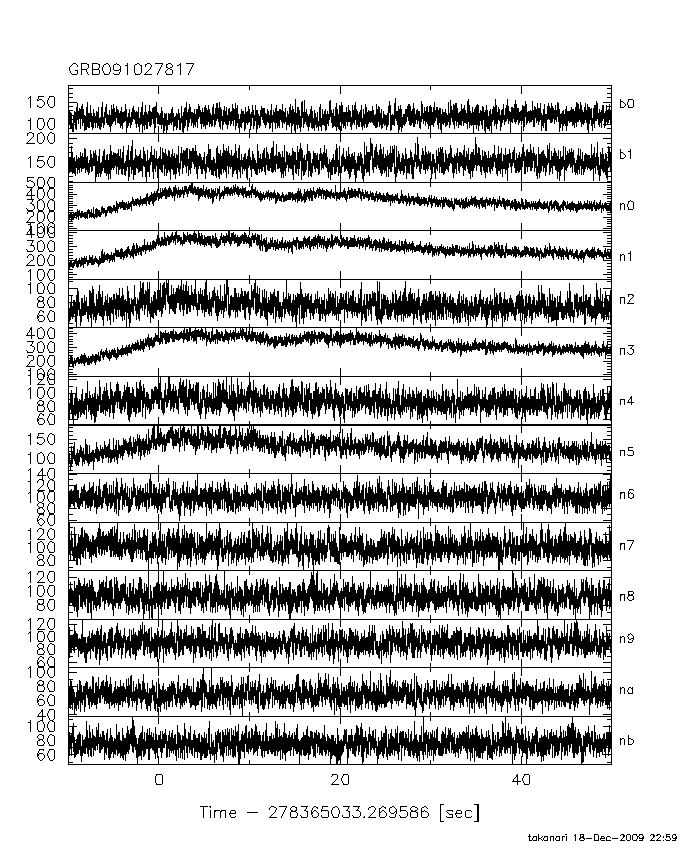
From T0-10 to T0+10
LAT Sky Image
Notes:
- 1) The data are from the LAT photon server: http://fermi.gsfc.nasa.gov/FTP/fermi/data/lat/allsky/
- 2) The LAT image is created using the Fermi-tool gtselect and gtbin.
- 3) The GBM position with 35 degree radius is used to create the image.
- 4) The energy range is from 100 MeV to 300 GeV.
- 5) The image is searched using ximage detect command. If ximage detect command finds any significant source, the result is shown at the bottom of the image
- 6) Green circle is the GBM error circle.
LAT light curves
Notes:
- 1) All the photons within a radius of 35 degrees from the GBM position are used to construct the light curve (because the GBM location is not that accurate).
1s binning
10s binning
GBM-LAT light curve (1s binning)
